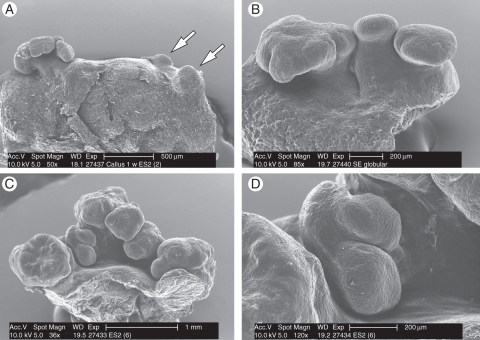
Fig. 3.
Scanning electron microscopy analyses during the induction of peach palm somatic embryos. (A) Initial development of isolated globular structures (arrows). (B) Small clusters of primary somatic embryos. (C) Development of secondary somatic embryos, resulting in a cluster of somatic embryos. (D) Globular somatic embryo revealing the development of secondary somatic embryos. Scale bars: (A) = 500 µm, (C) = 1 mm, (B, D) = 200 µm.

