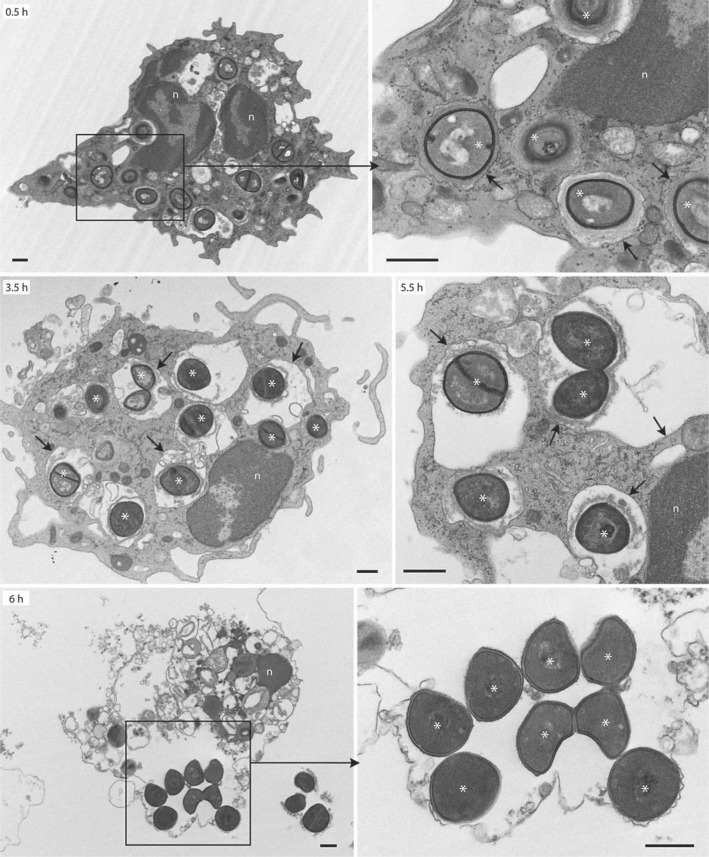
Fig. 7.
Ultrastructural analysis of USA300 phagosomes by TEM. Synchronized phagocytosis assays were performed with human neutrophils and opsonized LAC as described in Methods. Black boxes indicate the area magnified in the adjacent panel. Black arrows indicate intact phagosomes/phagosome membranes. Asterisks indicate LAC. Images are representative of experiments performed with 2 separate blood donors. Scale bar = 0.5 μm. n = Nucleus.

