
Figure 2.
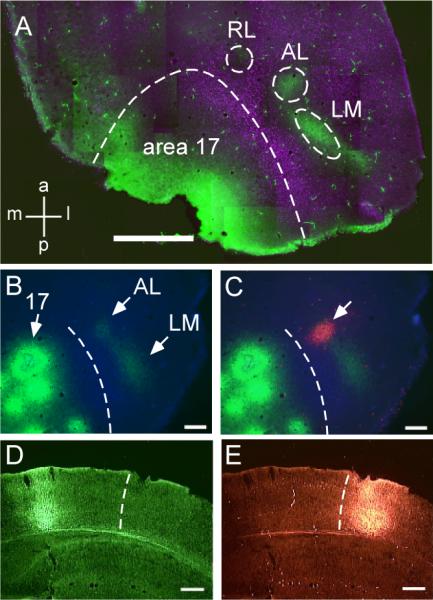
Successful injections targeted to areas 17 and AL. A: Montage of a tangential section of flattened cortex showing layout of relevant visual areas. The magenta label is bis-benzimide transport from contralateral injections and represents borders between some visual areas. Green patches in areas AL and LM are anterograde transport resulting from the area 17 injections. B, C: Location of injection sites in areas 17 and AL for case #28. B: Anterograde mapping of AL and LM after injection of BDA into area 17. The border separating area 17 from areas AL and LM is identified by the band of blue bis-benzimide labeled callosal projection neurons (dashed line). C: Same section as in panel B showing location of injection of DA-594 into AL (arrow). D, E: Coronal sections from case #37 showing injections of BDA in area 17 (D) and DA-594 in area AL (E). The injections span all layers of the cortex. The dashed line indicates the anteromedial limit of the band of callosal connections that separates area 17 from areas AL and LM. Scale bars: 1 mm in A, 250 μm in B–E. A magenta-green version of this figure is available as Supplementary Figure 1.