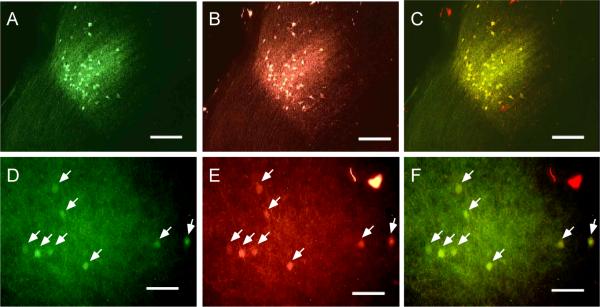
Figure 6.
Labeling efficiency of retrograde tracers. A–C: Labeled neurons in the LGN after combined injection of both tracers (BDA, DA-594) into area 17. A: LGN neurons labeled with BDA. B: LGN neurons labeled with DA-594. C: Overlay of panels A and B showing that all neurons were double-labeled. D–F: Labeled neurons (arrows) in area LM after combined injection of both tracers (BDA, DA-594) into area 17. D: LM neurons labeled with BDA. E: LM neurons labeled with DA-594. F: Overlay of panels D and E showing that all neurons were double-labeled. Scale bars: 100 μm in A–C, 50 μm in D–F.

