
Figure 3.
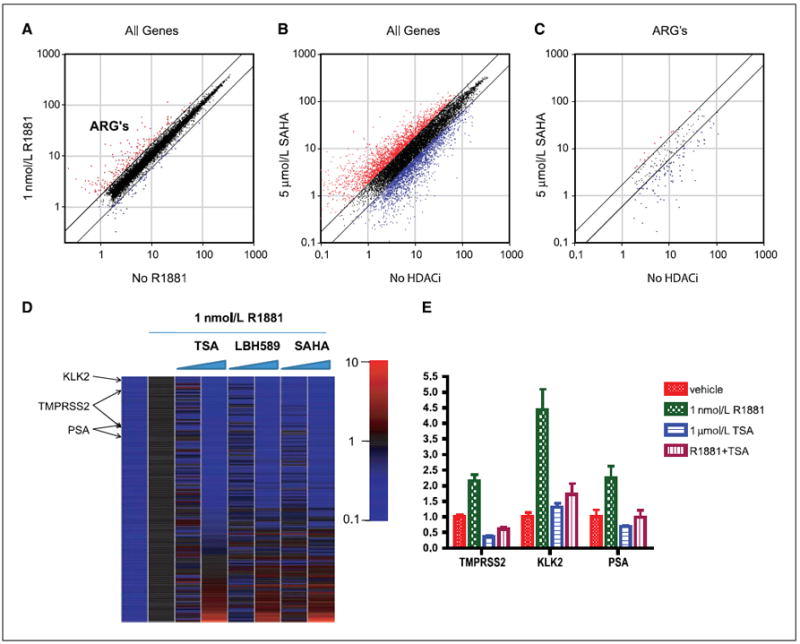
Effect of HDAC inhibitors on transcription of ARGs. LNCaP cells were starved for 3 d in charcoal-stripped serum and subsequently treated with the combination of HDAC inhibitor and R1881 in duplicate, as described in Materials and Methods. RNA was isolated, and expression profiling was performed. A, scatter plot of expression of all expressed genes at baseline (x axis) versus 1 nmol/L R1881 (y axis). Trend lines indicate 1.7-fold change; red dots are AR-induced genes, whereas blue dots are AR-suppressed genes. B, scatter plot of no HDAC inhibitor (HDACi) versus high-dose SAHA (5 μmol/L), which is representative of all three HDAC inhibitors at high dose. C, scatter plot of expression of ARGs (red dots from A) in cells treated with R1881 with or without 5 μmol/L SAHA. D, the expression levels of ARGs were normalized to no HDAC inhibitor and with 1 nmol/L R1881, and expression of genes is sorted from TSA suppression to TSA induction. First column represents uninduced expression and various shades of blue by definition. TMPRSS2, PSA, and KLK2 are indicated as shown. E, quantitative RT-PCR verification for PSA, KLK2, and TMPRSS2.