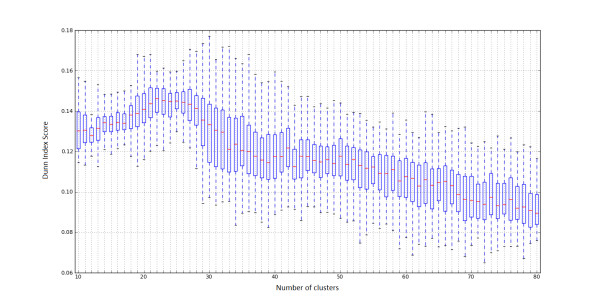
Figure 1.
Dunn Index results. Boxplot with Dunn Index results for k-means clustering. The x-axis represents the cluster number, while the y-axis represents the Dunn's cluster validity index scores. The experiment was repeated 100 times and the maximal Dunn Index score values were observed in the range of 19-36 cluster size.

