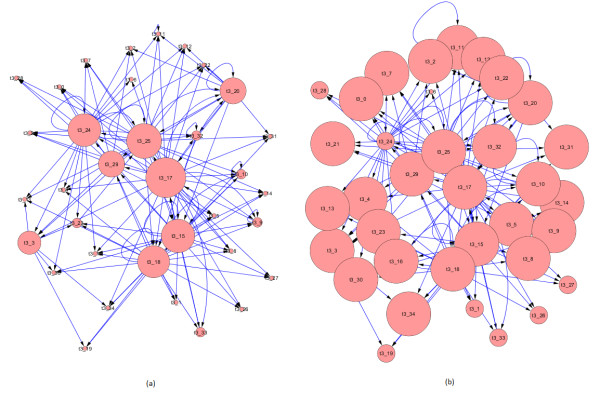
Figure 3.
Network Graph Structures. Network graph structures of the resulting TV-DBNs. Two indicative networks with different sized nodes from time point 3 are displayed, in terms of (a) outdegree score and (b) indegree score. Each node represents the time (t) of the respective network and the corresponding cluster number.

