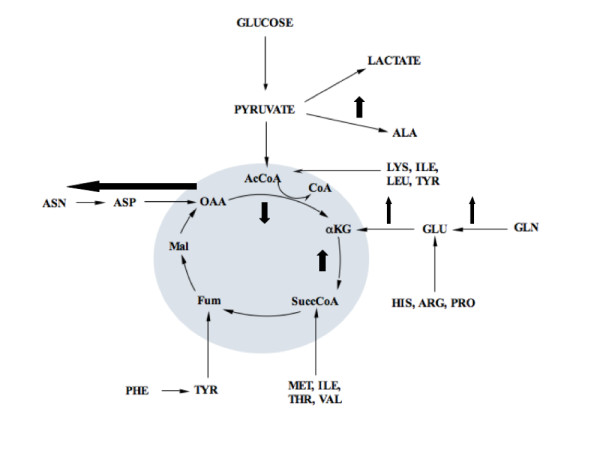
Figure 11.

Schematic of the changes in metabolic flux at steady state 3. Small black arrows indicate normal flux direction, while emboldened black arrows indicate the change in metabolic flux at this steady state. In this case, there was an increase in the flux towards production of alanine from pyruvate and asparagine and aspartate from oxaloacetate (likely caused by the increased ammonium concentration, see text for details). This resulted in a decrease in the flux from oxaloaceate to α-ketoglutarate. However, the flux through the TCA cycle was maintained by an increase in the flux from glutamine to glutamate and α-ketoglutarate, which resulted in an increase in the mean net flux from α-ketoglutarate to succinyl-CoA in the TCA cycle. The remaining calculated fluxes in the TCA cycle were comparable to those seen at the remaining steady states. Abbreviations are noted elsewhere.
