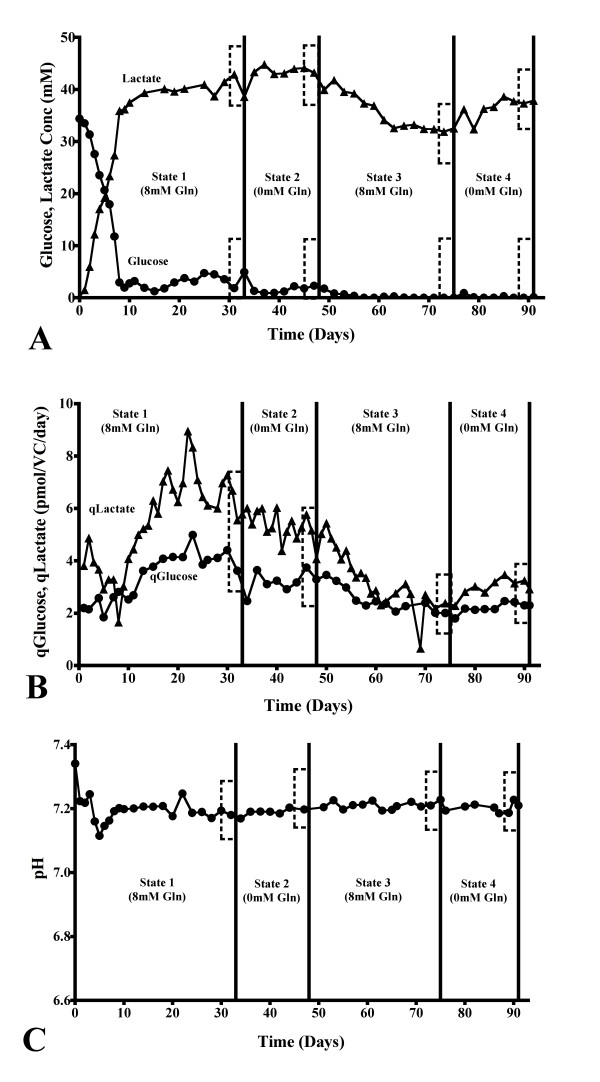
Figure 3.
The effects of glutamine on glucose, lactate and pH in bioreactor continuous culture. The concentrations and rates of consumption and production of glucose and lactate during continuous culture with varying glutamine concentrations in the culture medium (A and B, respectively). The extracellular culture pH during continuous culture with varying glutamine concentrations in the culture medium (C). Boxes are used to illustrate the steady state examined. Panels A, B and C, n = 8.

