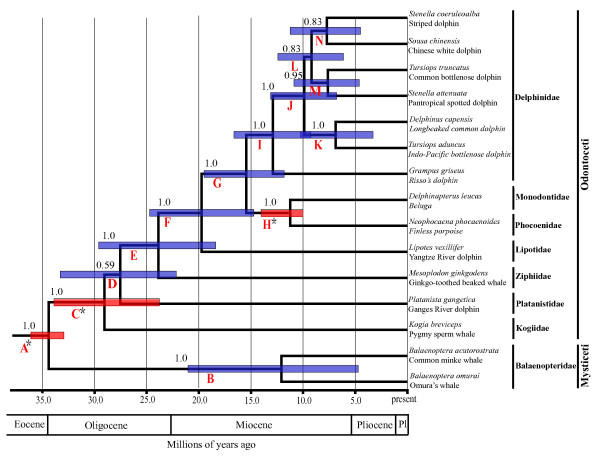
Figure 5.
Time-calibrated cetacean phylogeny derived from BEAST using the flanking regions of 12 retroposed elements. Numbers above the clades represent Bayesian posterior probabilities. Clade letters are identical to those in Table 1. Red boxes indicate nodes for which a prior calibration constraint distribution was used and blue boxes indicate divergence dates estimated without prior calibration constraints for that node. The bounds of the boxes correspond to the 95% highest posterior density (HPD) of each node.

