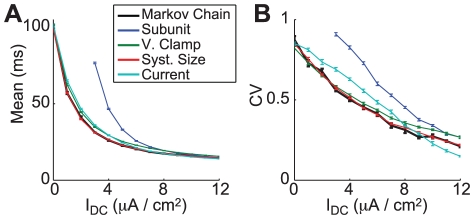
Figure 2. ISI statistics for DC input.
(A) Mean of ISIs for a membrane area of  channels). (B) CV of ISIs for same membrane area as (A). 500 spikes were used to estimate the mean and variance, and error bars indicate standard error in the mean for ten repeated measurements for all models except the Markov chain model, for which only four repeated measurements were used.

