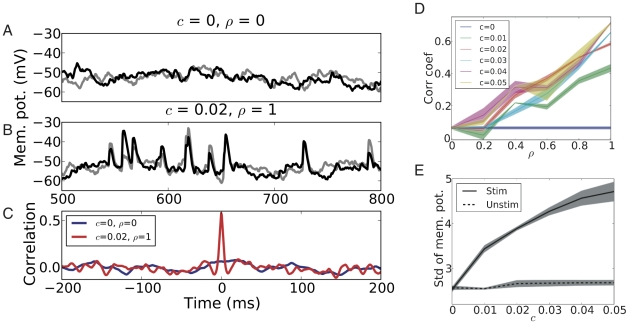
Figure 4. Correlations of the free membrane potentials of stimulated MSNs in the striatum network.
(A) Example of the free membrane potential traces of two stimulated MSNs without any input correlation ( = 0,
= 0,  = 0). As there was no correlation, neither within nor between the inputs to the two MSNs, the free membrane potentials did not show any significant correlation. (B) Example of the free membrane potential traces of two stimulated MSNs with moderate individual input correlation (
 = 0.02) and full shared correlation (
 = 1). Since here, the two MSNs were driven by correlated synaptic inputs, the free membrane potential traces showed significant correlation, together with substantial membrane potential fluctuations. (C) Cross correlation of the free membrane potentials of stimulated MSN pairs as a function of time lag
  for the two stimulus protocols. Strong correlation was observed at zero time lag for moderate individual input correlation (
 = 0.02) and maximum shared input correlation (
 = 1). (D) Average correlation coefficient at zero time lag of the free membrane potentials of stimulated MSN pairs as a function of shared input correlation
  , for different values of individual input correlation
  . The correlation coefficient increased monotonically with
  and did not show any dependence on
  . Note that the correlation coefficient had a small positive value for
  = 0, because of the small synchrony effect arising from the FB and FF inhibitions. (E) Standard deviation of free membrane potential fluctuations for stimulated (solid lines) and unstimulated (dashed lines) MSNs as a function of individual input correlation
  at different values of
  . The free membrane potential fluctuation of the stimulated MSNs increased monotonically with
  , whereas that of the unstimulated MSNs did not show any significant change.

