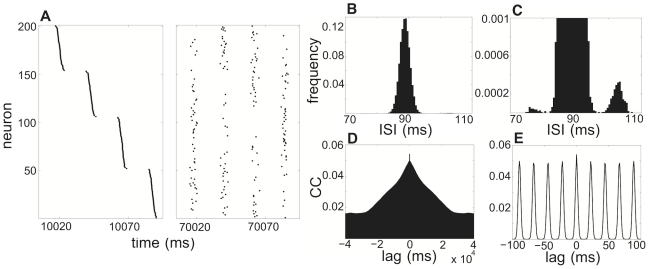
Figure 2. Neurons switch clusters via cycle skipping in a network of 200 excitatory and 40 inhibitory Traub neurons.
A network of 200 excitatory and 40 inhibitory neurons with  supports four clusters here for a population rhythm of about 45 Hz. A Spike times of neurons where index is sorted according to their spike times soonest after
  . After 60 s, neurons have become thoroughly mixed with other clusters. B Histogram showing frequency of interspike interval (ISI) for all excitatory neurons in network. Large peak is just above the calcium time constant
  , but smaller peak occurs at a higher ISI. C By zooming the scale of the frequency into
  , the small peak at larger ISIs is more visible. This suggests neurons switch clusters by skipping one cycle of the fast rhythm. D Correlation coefficient plotted over the domain of
  to
to  (
( to
to  ). Over long time intervals, correlations degrade, due to noise-induced cycle skipping or (rarer) early spiking. E For a tighter lag domain,
  to
to  (
( to
to  ), the ringing at discrete lag intervals due to consistent cluster time intervals is apparent. Same parameters are used here as in Fig. 1.

