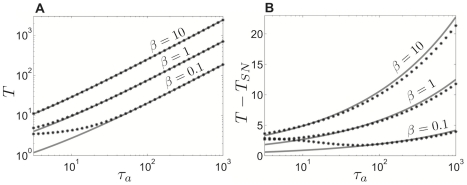
Figure 5. Period of the solution to the single adaptive theta neuron model.
We compare the period as calculated by evolving (2) numerically (black stars) against the analytically computed formula for period (4), derived using singular perturbation theory (grey line). A Period  plotted versus adaptation time constant
  . B Length of terminal layer
  plotted versus adaptation time constant
  . Input parameter
  .
.

