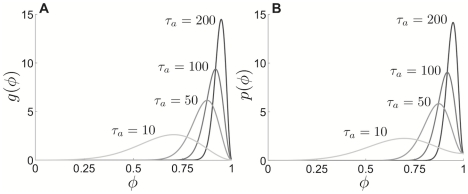
Figure 8. PRCs calculated numerically using the adjoint equation.
PRCs calculated for the A QIF model with adaptation and B theta model with adaptation as function of phase for various adaptation time constant  values. For visualization purposes, the PRCs have all been normalized to integrate to unity. Other parameters are
  and
and  .
.

