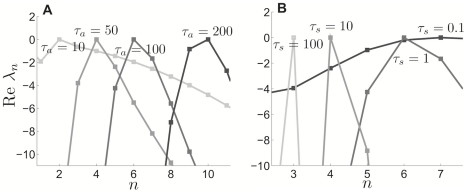
Figure 9. Eigenvalues associated with linear stability of incoherent state predict cluster number.
Plots show real part of eigenvalues Re at the critical noise amplitude
  at which the incoherent state destabilizes. A When the adaptation time constant is varied as
  , the corresponding predicted number of clusters, in the weak coupling limit, is
  respectively given by (23). Synaptic time constant
  . B When the synaptic time constant is varied as
  , the corresponding predicted number of clusters, in the weak coupling limit, is
  . Adaptation time constant
  . Other parameters are
  ,
,  , and
, and  .
.

