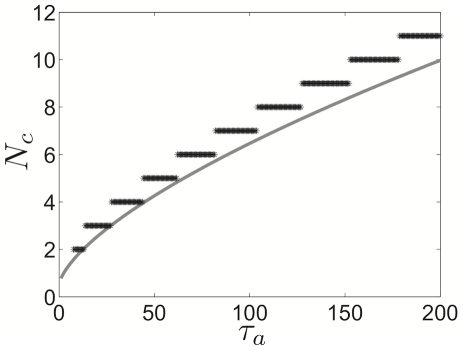
Figure 10. Weak coupling and singular perturbation approximations of cluster number.
Cluster number  approximations comparison between that given by weak coupling (black stars) – equation (23) – and that given by singular perturbative approximation (grey line) – equation (6). For purposes of comparison, we use pulsatile coupling (
 ) for weak coupling approximation. Other parameters are
  and
and  .
.

