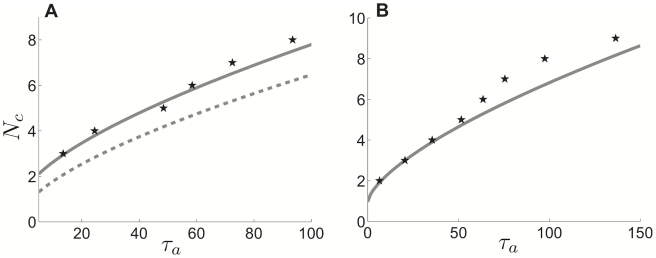
Figure 15. Comparison of cluster number relationship to adaptation time constant in theory and numerical simulations in idealized model.
Minimal  value at which
  clusters appear in network, a comparison of theory and numerical simulations. Solid grey lines denote theory predicted by weak coupling analysis (fit using least squares approach in Methods). A Pulsatile synapses, as predicted by singular perturbation theory (dashed grey) and weak coupling (solid grey); compared with numerical simulations (black stars). B Exponential synapses with
  . Other parameters are
  ,
,  ,
,  .
.

