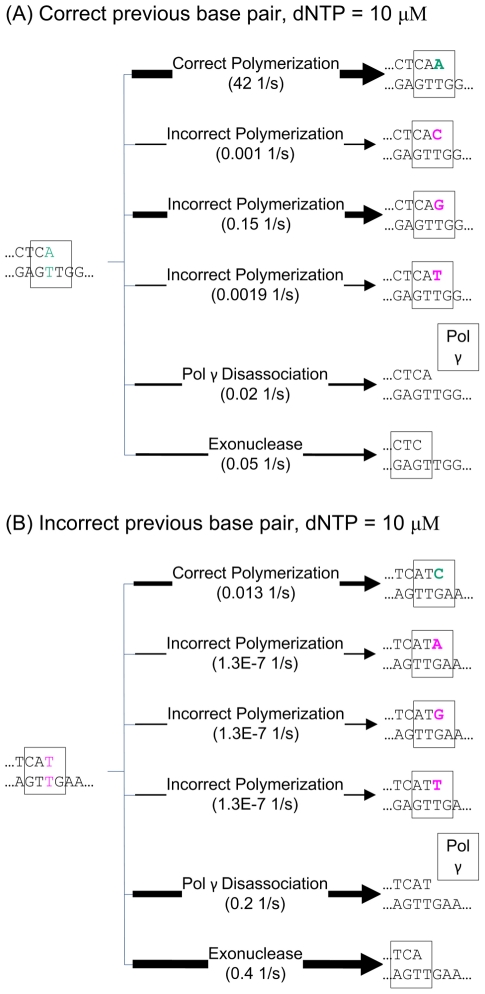
Figure 2. Diagrams of the six competing reactions of pol γ.
Example reaction rates are given below each reaction name. The line size approximately represents the reaction rate. The bigger the reaction rate, the wider the line. (A) For a correct previous base pair, the highest reaction rate by far is the correct polymerization. (B) For an incorrect previous base pair, the highest reaction rate is the exonuclease reaction, allowing proofreading. All reaction rates in this diagram are calculated for dNTP pool levels equimolar at 10 µM.

