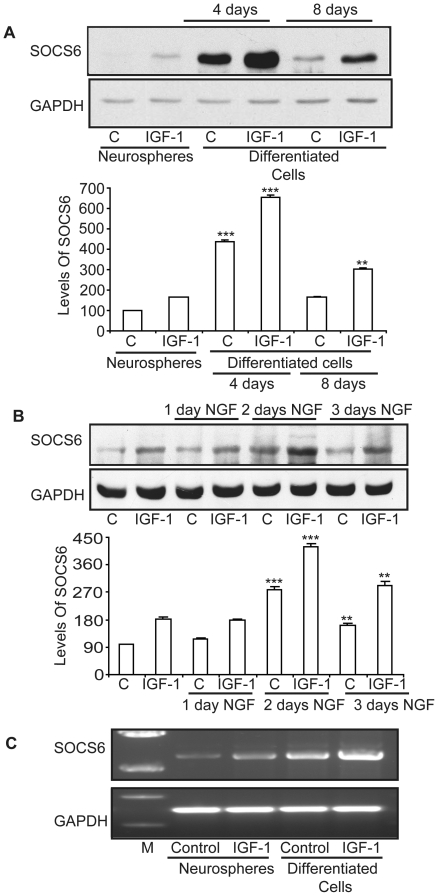
Figure 3. Temporal increase in SOCS6 levels following differentiation.
(A) Western-blot analysis of SOCS6 expression in E14 neurospheres and neurospheres upon differentiation at day 4 and day 8 with/without 3 hours of IGF-1 (20 ng/ml) stimulation. The same membrane was stripped and reprobed with anti-GAPDH antibody for protein loading control. (B). Western-blot analysis of SOCS6 expression in undifferentiated PC12 cells and PC12 cells differentiated with NGF (50 ng/ml) for 1, 2 or 3 days and stimulated with/without IGF-1 for 3 hours. The same membrane was stripped and reprobed with anti-GAPDH antibody for protein loading control. (C) E14 neurospheres or neurospheres upon 4 days of differentiation were stimulated with/without IGF-1. Total RNA was isolated and RT-PCR was performed using SOCS6 specific primers and GAPDH primers on the same sample. (M = Marker; C = Control). The result shows the mean ± S.E. of n = 3 combined experiments (***p<0.001, **p<0.01). The densitometry shown below was normalized with the untreated control (taken as 100%).

