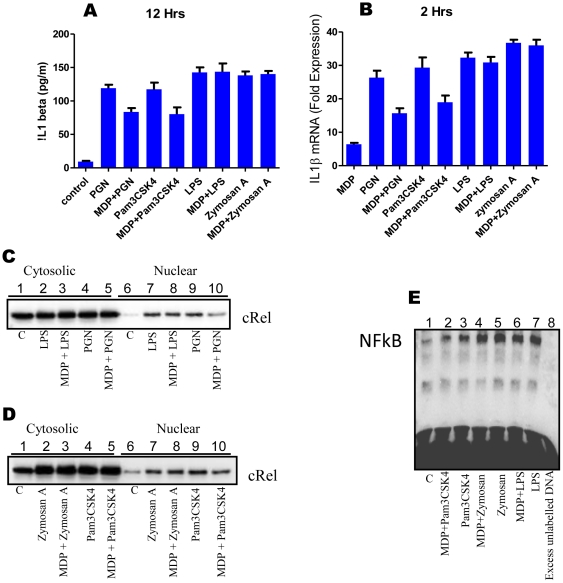
Figure 4. MDP mediated downregulation is specific for TLR2/1 ligands.
(A-E), (A) ELISA for IL1β; macrophages were stimulated as indicated. Culture supernatants were collected after 12 hours and checked for the presence of IL1β. Each well contained 1×10⁶ macrophages. Statistical significance was checked by one way ANOVA. P value was found to be significant (<0.0001). (B) Real time RT-PCR analysis of IL1β mRNA: Macrophages were stimulated as indicated for 2 hours. Total RNA was isolated and checked for the presence of IL1β transcripts. Statistical significance was checked by one way ANOVA. P value was found to be significant (<0.0001). (C and D) Western blot analyses of nuclear translocation of cRel subunit of NF-κB. Macrophages were stimulated for 40 minutes as indicated. Nuclear and cytosolic extracts were prepared and run on 10% SDS-PAGE. 30 µg of nuclear protein was loaded in each well corresponding to nuclear fraction. (E) Electrophoretic mobility shift Assay for NF-κB. Macrophages were stimulated for 40 minutes as indicated. Nuclear extracts were prepared and incubated with 100 fmol of biotinylated NF-κB binding sequence. EMSA was performed as described. Lane1: untreated macrophages (43); lane2: MDP+Pam3CSK4 treated macrophages (59); lane3: Pam3CSK4 treated macrophages (75); lane4: MDP+zymosan A treated macrophages (94); lane5: zymosan A treated macrophages (91); lane6: MDP+LPS treated macrophages (83); lane7: LPS treated macrophages (87); lane8: Nuclear extract of Pam3CSK4 stimulated macrophages is incubated with 100 fmol biotinylated NF-κB binding DNA and 100 pmol of unlabelled NF-κB binding DNA (43). Values in brackets indicate average integrated density values of spot densitometric analysis using software Alpha Imager. Results in graph are presented as the mean of triplicate wells ± SD. Western blot and EMSA correspond to one representative experiment of three and two independent experiments respectively.

