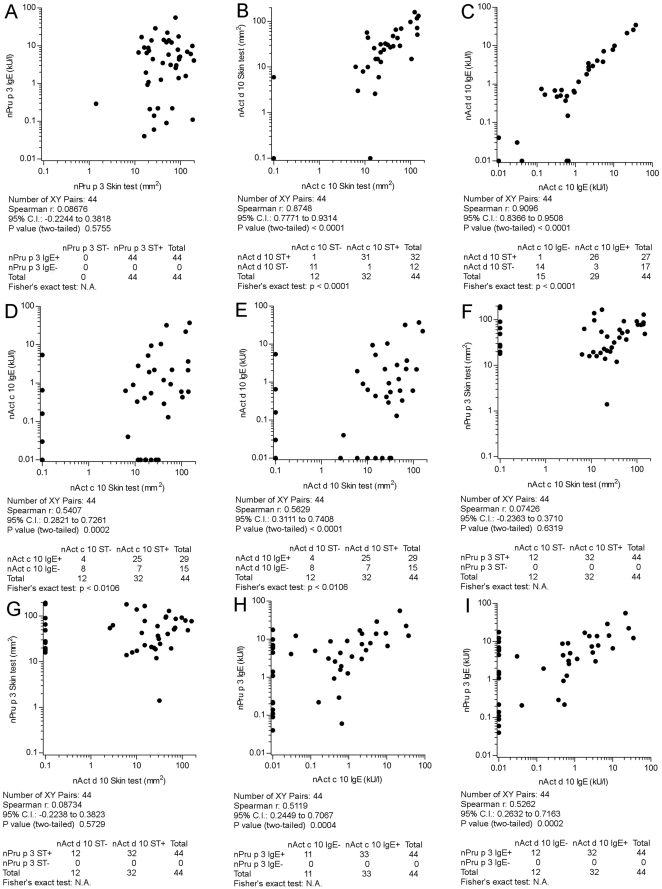
Figure 3. Comparative skin testing and IgE detection using nAct c 10, nAct d 10, and nPru p 3 in 44 peach clinically allergic subjects tested positive for nPru p 3 on ISAC 103.
Panels A to I report correlation and concordance results for each paired allergen preparation and test as in the graphs. The Spearman r correlation coefficient and the Fisher's exact test have been used for statistical evaluations. Statistics are reported below each graph. IgE results have been obtained using ISAC microarray Exp96 and reported as kU/l; skin test have been obtained by measuring wheal areas and reported as mm2 . For graphical visualization needs on log scales, zero values for the skin test have been set at 0.1 mm2, and at 0.01 kU/l for ISAC values.

