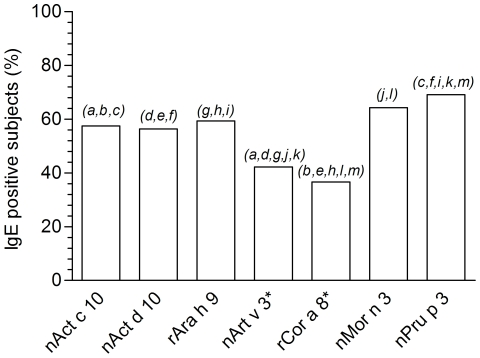
Figure 4. IgE prevalence for nAct c 10, nAct d 10, rAra h 9, nArt v 3, rCor a 8, nMor n 3, nPru p 3 on 431 sera.
Prevalence has been calculated on 431 patients having at least one positive IgE test for one of the LTP under study. Asterisk marks LTPs tested on ISAC 103; remaining have been tested on ISAC Exp96. Statistical comparative evaluation has been performed using the χ2 test to evaluate the overall differences among all seven values. Pair-wise comparison has been performed using the Tukey post hoc test. “p” values, for paired letters in italics on top of the two corresponding bars, were as follows: a: p = 0.00015; b, e, g, h, j, k, l, m: p<0.0001; c: p = 0.0076; d: p = 0.00067; f: p = 0.0021; i: p = 0.045.

