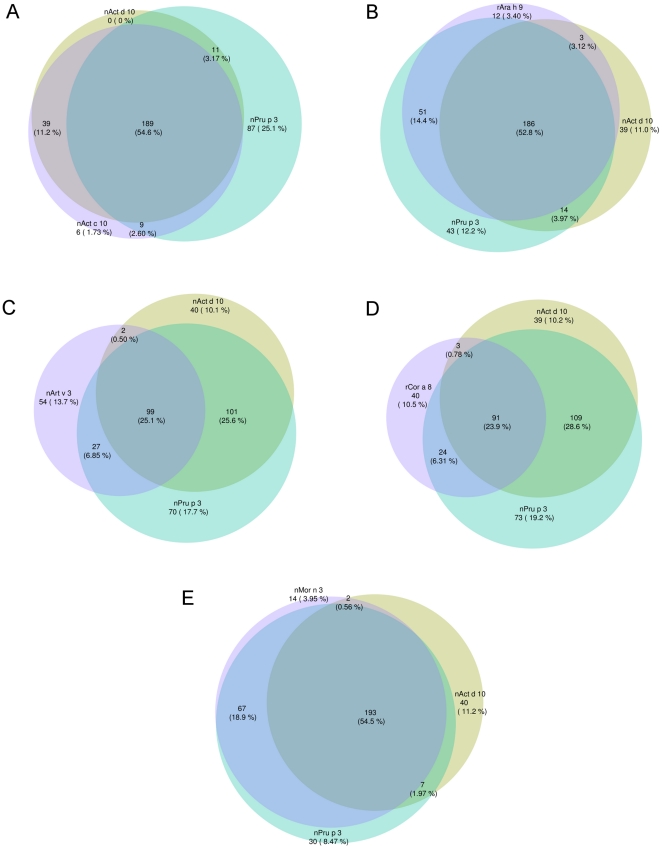
Figure 5. Venn diagram representation of positive IgE results for selected LTPs.
LTP specific IgE have been determined using ISAC Exp96, excepting for nArt v 3 and rCor a 8where ISAC 103 has been used. Due to the highly similar behavior of the two kiwifruit LTPs, panel from B to E show how the other four LTPs behave compared to nAct d 10 and nPru p 3. Absolute and relative IgE prevalence are given for each combination on graphs as follows: Panel A: nAct c 10, nAct d 10, and nPru p 3; Panel B: nAct d 10, nPru p 3, rAra h 9; Panel C: nAct d 10, nPru p 3, nArt v 3; Panel D: nAct d 10, nPru p 3, rCor a 8; Panel E: nAct d 10, nPru p 3, nMor n 3.

