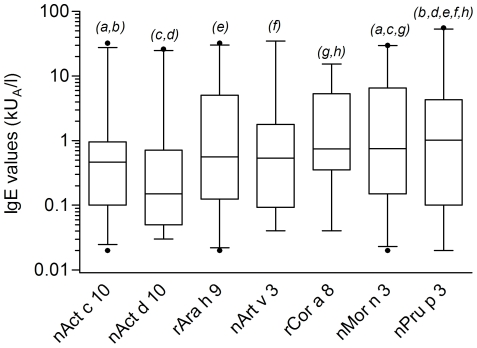
Figure 7. IgE values box-plot representation considering median values and 5–95 percentile distributions.
IgE value distribution is plotted for positive values. Kruskal-Wallis One-Way ANOVA by Ranks test gave a statistically significant p value (<0.0001). The pair-wise comparison with a Mann-Whitney test with Bonferroni correction applied to LTP IgE results gave p values, considering paired letters in italics on top of the two corresponding bars, as follows,: a: p = 0.00218; b, d, h: p<0.0001; c: p = 0.00014; e: p = 0.00093; f: p = 0.00079; g: p = 0.03402.

