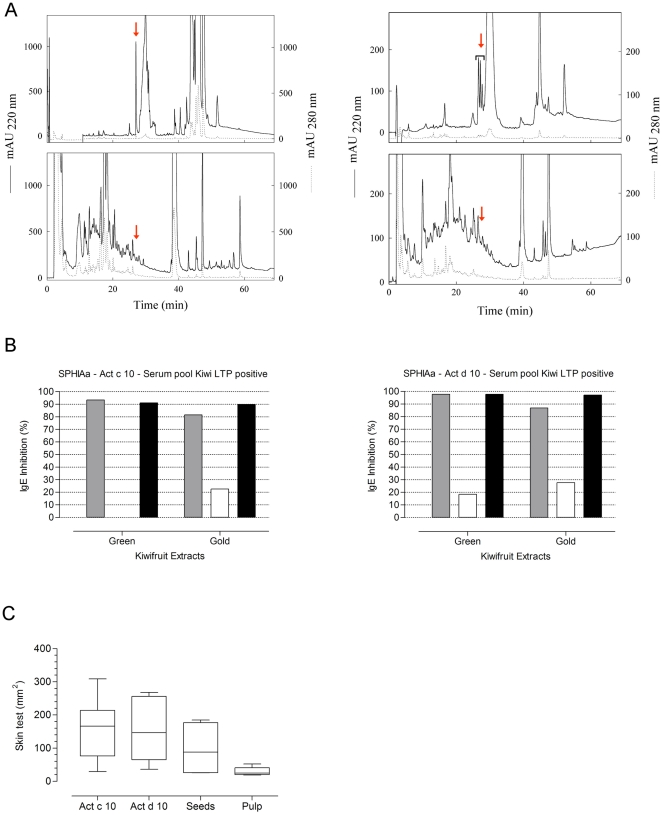
Figure 12. Biochemical, immunochemical, and clinical evaluation of LTP distribution in kiwifruit tissues.
Panel A, Left: RP-HPLC profiles of the pulp (upper part) and seed (lower part) protein extracts of gold kiwifruit tissues. The amount of loaded proteins was 1 mg. The arrow indicates the elution time of Act c 10. Panel A, Right: RP-HPLC profiles of the pulp (upper) and seed (lower) protein extracts of green kiwifruit tissues. The amount of loaded proteins was 0.3 mg. The arrow indicates the elution time of Act d 10. Panel B: Single Point Highest Inhibition Achievable assay (SPHIAa) using pulp and seed extract preparations from green and gold kiwifruits. Grey bars: total kiwifruit extracts; White bars: bars: kiwifruit pulp extracts; Black bars: kiwifruit seed extracts. Panel C: Skin test using nAct c 10, nAct d 10, and green kiwifruit seed and pulp preparations. Skin test wheal areas have been recorded and expressed in mm2. The Mann-Whitney test applied to paired test result distributions gave p values as follows: Act c 10 vs Act d 10 p = n.n.s.; Act d 10 vs Seeds p = n.n.s.; Act d 10 vs Pulp p<0.004; Seeds vs Pulp p<0.017.

