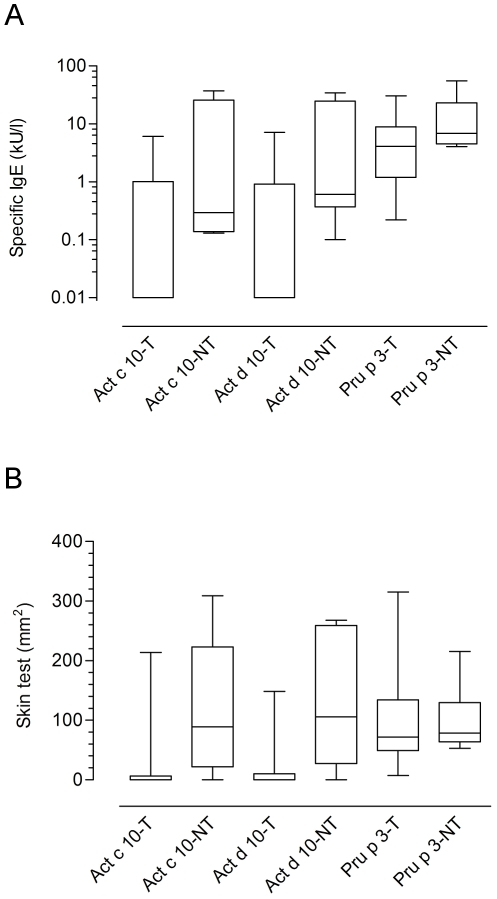
Figure 13. IgE and Skin test result evaluation comparing patients being tolerant or not to green kiwifruit ingestion.
NT = Green kiwifruit Non-Tolerant; T = Green kiwifruit Tolerant. Panel A: IgE values obtained testing serum samples for nAct c 10, nAct d 10, and nPru p 3 on ISAC Exp96. The Mann-Whitney test applied to tolerant versus non-tolerant patients for each test gave p values as follows: Act c 10-T vs Act c 10-NT p = n.n.s.; Act d 10-T vs Act d 10-NT p<0.05; Pru p 3-T vs Pru p 3-NT p = n.n.s. Panel B: Skin test wheal area values obtained for nAct c 10, nAct d 10, and nPru p 3. Skin test wheal areas have been recorded and expressed in mm2. The Mann-Whitney test applied to tolerant versus non-tolerant patients for each test gave p values as follows: Act c 10-T vs Act c 10-NT p<0.02; Act d 10-T vs Act d 10-NT p<0.01; Pru p 3-T vs Pru p 3-NT p = n.n.s.

