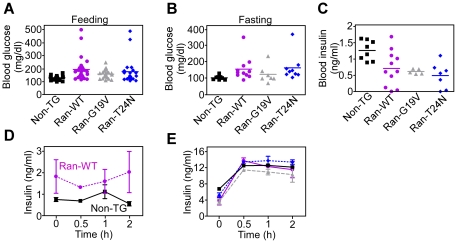
Figure 2. Transgenic expression of Ran impairs glucose metabolism.
A and B, The indicated PCR-confirmed transgenic mice were analyzed for blood glucose content at 2 mo of age under ad libitum feeding (A) or fasting (B) conditions. Non-TG, non-transgenic mice. Glucose concentrations (mg/dl) in each group in A (number of mice in parentheses), and statistical analyses (unpaired t test) are as follows: Non-TG (n = 24), 125±2; Ran-WT (n = 26), 189.4±17.8, p = 0.013; Ran-G19V (n = 24), 153.7±6.5, p = 0.003; Ran-T24N (n = 21), 172.4±21.1, p = 0.02. Statistical data re-analysis of the groups in A using ANOVA and post-hoc multiple tests with Bonferroni procedure was as follows: Ran-WT, p<0.0001; Ran-G19V, 0.017; Ran-T24N, p = 0.029. C, The indicated non-TG or Ran transgenic mice were analyzed for blood insulin concentrations. Insulin levels (ng/ml) in each group (number of mice in parentheses), and statistical analyses (unpaired t test) are as follows: Non-TG (n = 8), 1.26±0.1; Ran-WT (n = 11), 0.7±0.16, p = 0.019; Ran-G19V (n = 5), 0.61±0.03, p = 0.0008; Ran-T24N (n = 7), 0.49±0.14, p = 0.0009. Statistical data re-analysis using ANOVA and post-hoc multiple tests with Bonferroni procedure was as follows: Ran-WT, p = 0.023; Ran-G19V, p = 0.031; Ran-T24N, p = 0.004. One outlier mouse in the Ran-G19V group with aberrantly high insulin level (2.35 ng/ml) was excluded from the analysis. For panels A–C, each point corresponds to an individual mouse. D, Islets (20/well) isolated from non-TG or Ran-WT transgenic mice were incubated with 5 mM D-glucose, and analyzed for insulin release in the supernatant at the indicated time intervals. Mean±SD of replicates. E, Islets (20/well) isolated from non-TG (black) or Ran-WT (purple), Ran-G19V (grey) or Ran-T24N (blue) transgenic mice were incubated with 16.7 mM glucose, and analyzed for insulin release in the supernatant at the indicated time intervals. Mean±SD of replicates.

