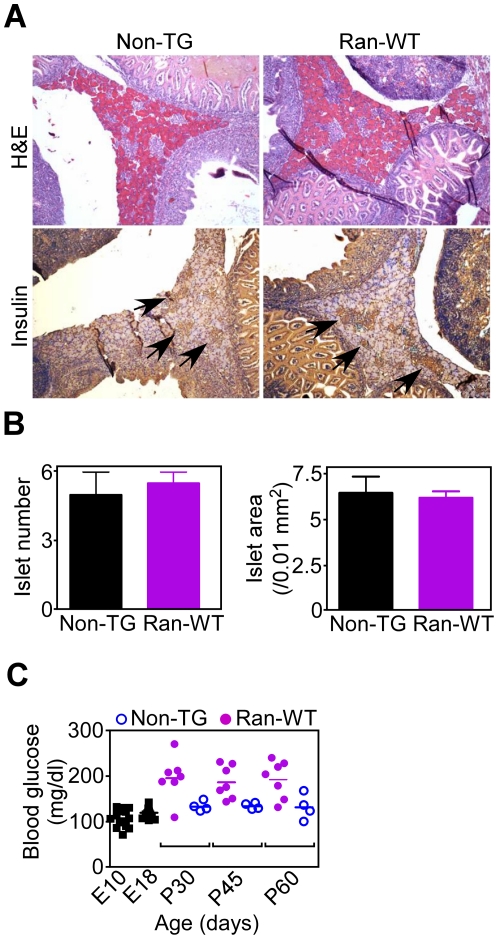
Figure 5. Postnatal defect in islet development in Ran transgenic mice.
A, E18 non-TG or Ran-WT embryos were analyzed by H&E or immunohistochemical staining with an antibody to insulin. Arrows, insulin-stained islets. B, Islet number (left), or islet surface area (right), was quantified in E18 non-TG or Ran-WT transgenic embryos by morphometry of insulin-stained sections. The differences among groups are not statistically significant. C, Littermates of Ran-WT diabetic mice crossed with normal mice were analyzed for changes in blood glucose levels at the indicated time intervals. E, embryonic; P, postnatal. Glucose levels in PCR-confirmed non-TG (open circles) or Ran-WT transgenic (closed circles) mice are shown. Each point corresponds to an individual mouse. Glucose concentrations (mg/dl) in each group (number of mice in parentheses), and statistical analyses versus E18 values are as follows: E10 (n = 15), 108.7±4.93; E18 (n = 15), 120.7±2.7; P30 Ran-WT (n = 7), 196.3±17.8, p<0.0001; P30 non-TG (n = 4), 134±5.4; P45 Ran-WT (n = 7), 187.1±13.5, p<0.0001; P45 non-TG (n = 4), 134.8±3.4; P60 Ran-WT (n = 7), 193.1±15.5, p<0.0001; P60 non-TG (n = 4), 132.5±13.9. Statistical data re-analysis using Mann-Whitney test was as follows: P30 Ran-WT, p = 0.013; P45 Ran-WT, p = 0.0006; P60 Ran-WT, p = 0.0009.

