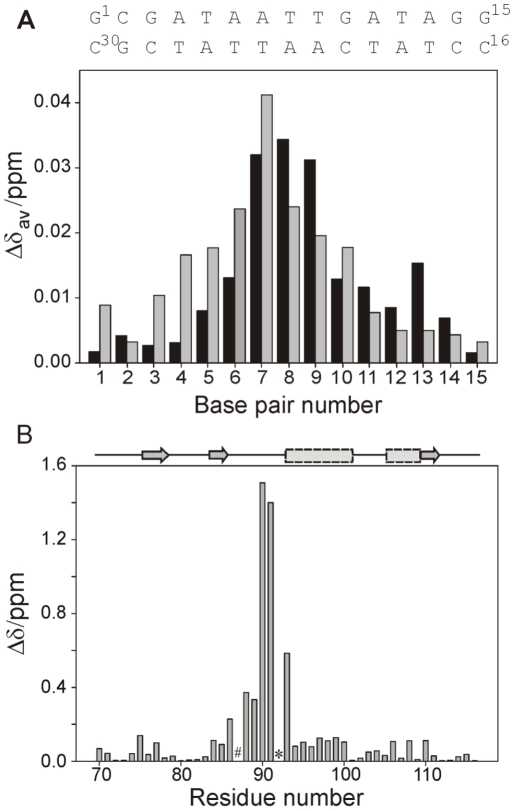
Figure 2. NMR analysis of the CT-Ler/LeeH interaction.
(A) Mean absolute changes in 1H-NMR chemical shifts caused by the addition of 0.5 equivalents of CT-Ler. The average is over all resolved resonances per nucleotide. The upper and lower LeeH strands are identified by black and gray bars, respectively. (B) Backbone amide chemical shift changes in CT-Ler ( ) upon complex formation with LeeH. The scaling factor
  corresponds to the ratio of 15N and 1H magnetogyric constants. Resonances that were not observed are denoted by # (Gly87) or * (Pro92).

