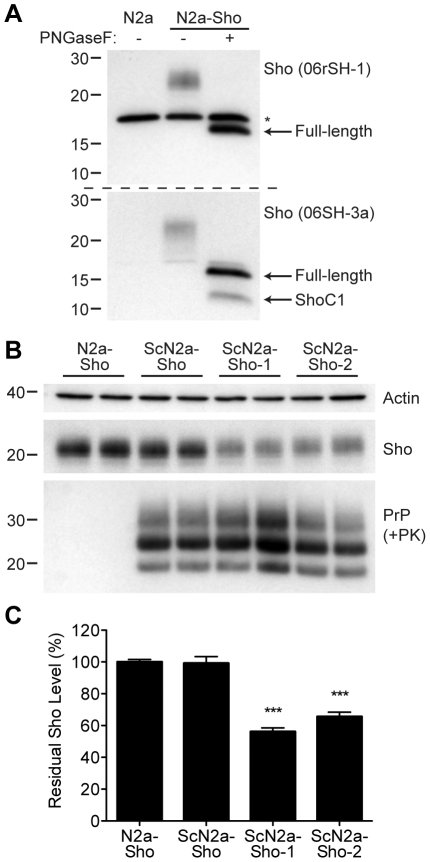
Figure 4. Decreased Sho levels in ScN2a-Sho cells.
(A) Western blot analysis of Sho levels in untransfected N2a-Sho cells. Samples were treated with PNGaseF to remove N-glycans, as indicated. Blots were probed with anti-Sho antibodies 06rSH-1 (top blot) and 06SH-3a (bottom blot) recognizing N-terminal and C-terminal Sho epitopes, respectively. An asterisk (*) denotes a cross-reactive band of ∼17 kDa, which is also detected in N2a cells, recognized by the 06rSH-1 antibody. Whereas both the N- and C-terminal antibodies recognize full-length, unglycosylated Sho (∼16 kDa), the C-terminal antibody also detects an endoproteolytic Sho fragment (ShoC1 fragment). Molecular masses based on the migration of protein standards are shown in kilodaltons. (B) In heterogeneous ScN2a-Sho cells, Sho levels were not decreased. However, upon further subcloning of ScN2a-Sho cells to obtain a more uniform population of infected cells (ScN2a-Sho-1 and ScN2a-Sho-2 subclones), a notable decrease in Sho levels was observed. ScN2a-Sho cells harbor PK-resistant PrPSc, as detected by the antibody HuM-D18. Actin levels are shown as a control. Molecular masses based on the migration of protein standards are shown in kilodaltons. (C) Quantification of Sho levels in ScN2a-Sho-1 (n = 10) and ScN2a-Sho-2 (n = 5) subclones revealed a significant decrease of 40–45% compared to the uninfected parental cell line (n = 15) (***P<0.001).

