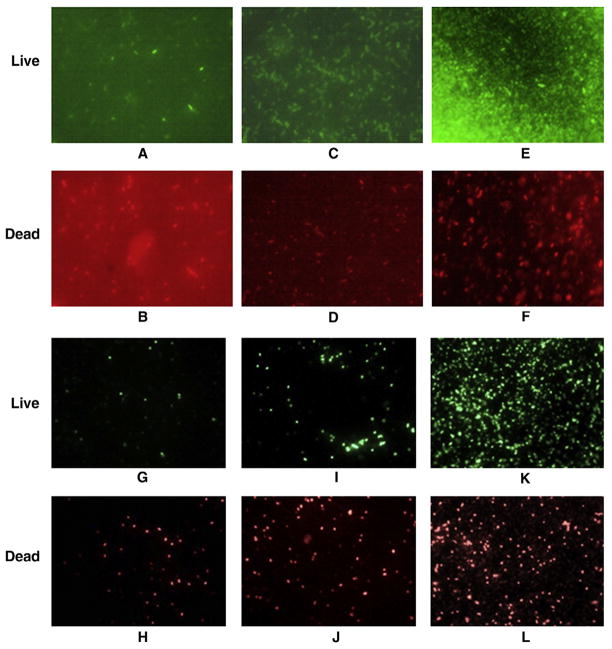
Figure 5.
Fluorescent microscopy images of live and dead bacterial cells in presence of silver NPs, using green and red UV-visible filters, respectively. (A, B) 100 μg/mL Ag-SiO2 NPs + E. coli ATCC 25922; (C, D) 8.5 μg/mL Ag colloid NPs + E. coli ATCC 25922; (E, F) control having only E. coli ATCC 25922; (G, H) 100 μg/mL Ag-SiO2 NPs + E. coli O157:H7; (I, J) 8.5 μg/mL Ag colloid NPs + E. coli O157:H7; (K, L) control containing only E. coli O157:H7.

