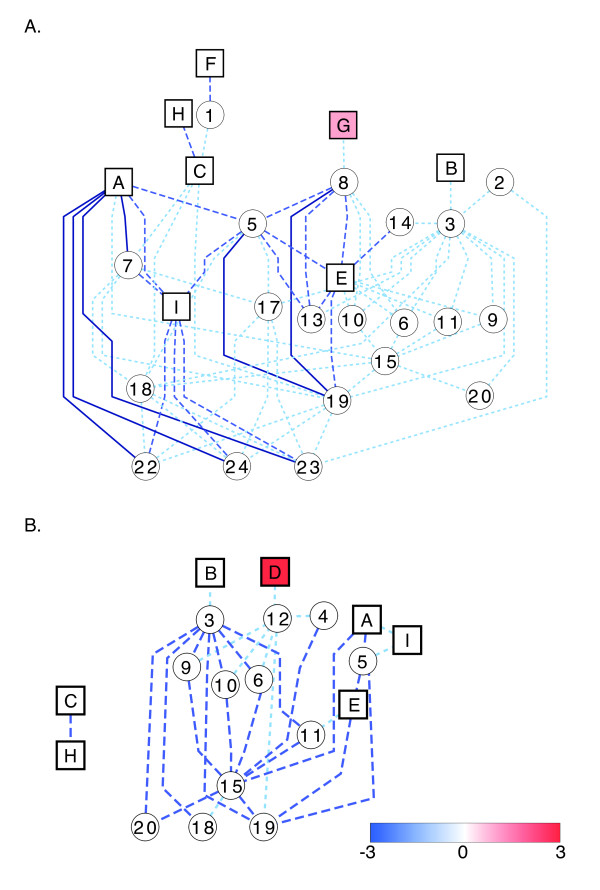
Figure 6.
Networks of hormone pathways in PEG-treated plants. Networks were created considering the shortest paths connecting each hormone-related pathway to another hormone-related pathway in shoots (A) and roots (B). Hormone-related and non-hormone-related pathways are denoted as squares and circles, respectively, and are shaded based on the number of genes up-regulated within the pathway minus the number of genes down-regulated. Pathways that contain equal numbers of up- and down-regulated genes are white. Edges connecting the pathways occur only when differentially expressed genes are in common between the two pathways. Dark blue solid lines, blue long-dashed lines, and light blue short-dashed lines denote ≥10, 6-9, ≤5 DE genes, respectively, in common between the pathways. Pathway names (A-I and 1-24) are denoted as in Figure 5.

