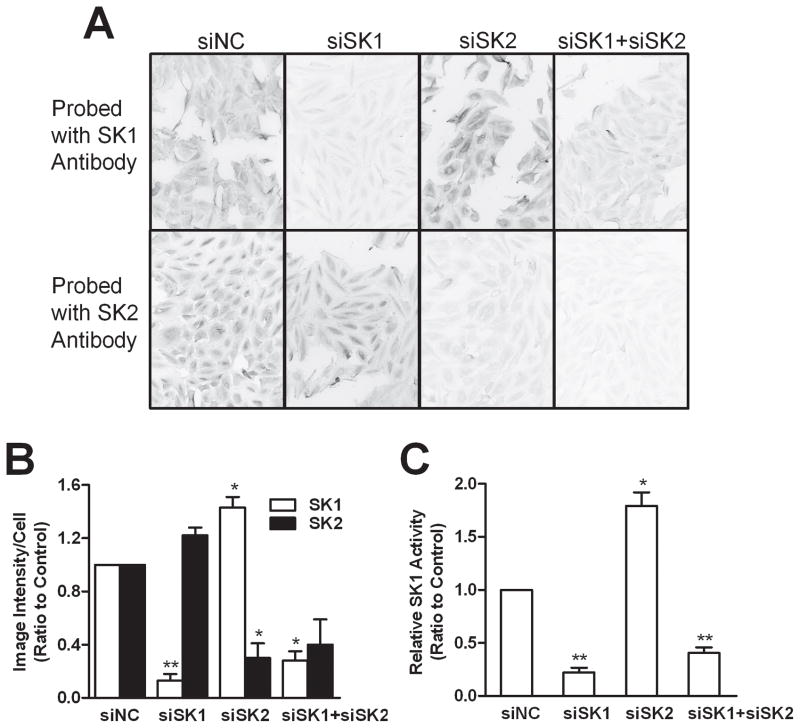
Figure 2. Effects of SK siRNA transfection on the expression of SK1 and SK2 protein.
At 72 hr after transfection, A498 cells were probed with antibodies against SK1 (A, top row) or SK2 (A, bottom row) and visualized with a fluorescent secondary antibody. Images were acquired with identical exposure parameters, and are representative of at least 5 areas from each sample. B) Expression above was quantified by imaging pixel intensity/cell, and the relative protein expression levels of SK1 (open bars) and SK2 (filled bars) were calculated relative to control (siNC). C) The enzymatic activity of SK1 was determined relative to control (siNC-treated) cells. Data represent the mean ± SEM of three independent experiments. *p<0.05, **p<0.01, ***p<0.001 versus control.

