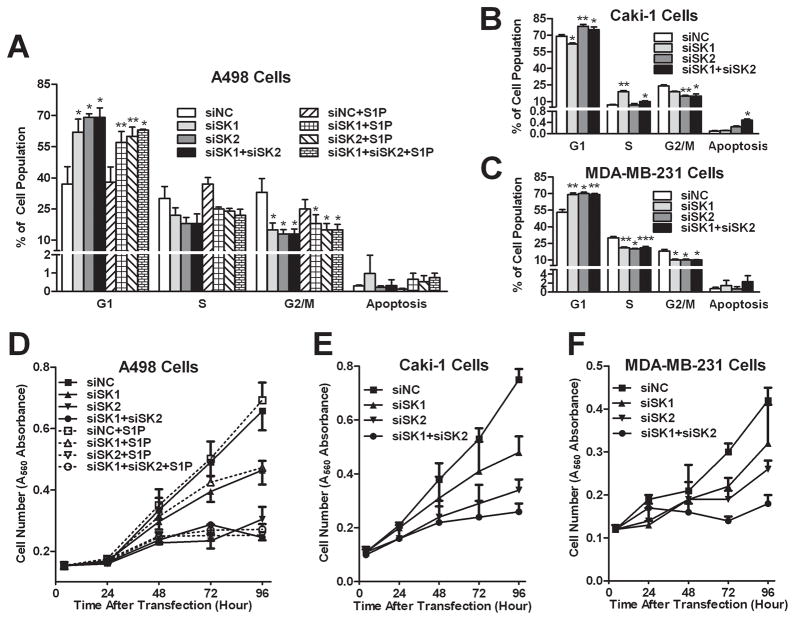
Figure 4. Effects of SK siRNA transfection on the cell cycle profile and proliferation.
A498 (A, D), Caki-1 (B, E) or MDA-MB-231 (C, F) cells were harvested 72 hr after siRNA transfection (A, B, C) for cell cycle distribution determination, or cell-number-quantified to plot growth curves (D, E, F). For A498 cells (A, D), 1 μM S1P was added to certain samples as indicated. Data (A, B and C) are mean ± SEM of three independent experiments. *p<0.05, **p<0.01, ***p<0.001 versus siNC control. Data (D, E and F) are mean ± SD and representative of at least two independent experiments.

