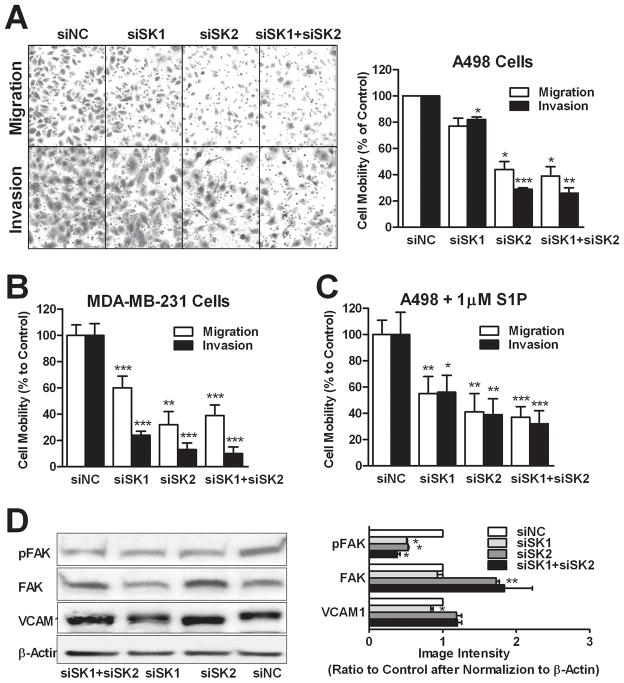
Figure 6. Effects of SK siRNA transfection on cell migration.
A498 (A, C and D) or MDA-MB-231 (B) cells were transfected with siRNAs as indicated and transwell migration and gel invasion assays were performed. In the experiment depicted in panel C, 1 μM S1P was added to both sides of the migration chambers. A) Photos of cells having passed through uncoated (migration) or coated (invasion) filters are representative of at least 5 fields per treatment. Bars in A, B and C represent the percentage of the migratory (open bars) of invasive (filled bars) cells compared with control (siNC). D) Immunoblotting was conducted with the indicated antibodies and quantified. Data are mean ± SEM of three independent experiments except C and D (mean ± SD of triplicates). *p<0.05, **p<0.01, ***p<0.001 versus control.

