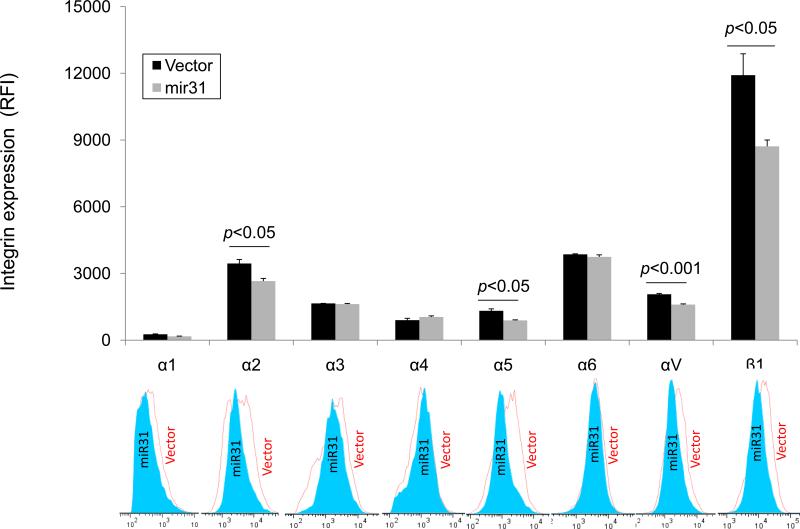
Fig. 2. Surface expression of integrin α-subunits and their β1 subunit partner is suppressed by miR-31.
Expression profiles of different integrin α subunits in MDA-MB-231 cells overexpressing GFP-pBABE vector control or GFP-miR-31. Surface expression of different α subunit partners of the β1 integrin subunit is quantitated as the relative fluorescence intensity (RFI) with subunit specific mAbs by flow cytometry. Values are means± S.E. and are representative of 3 independent experiments. Representative histograms are provided below in which the empty histograms are for the vector control and the filled histograms are for miR-31 overexpressing cells.

