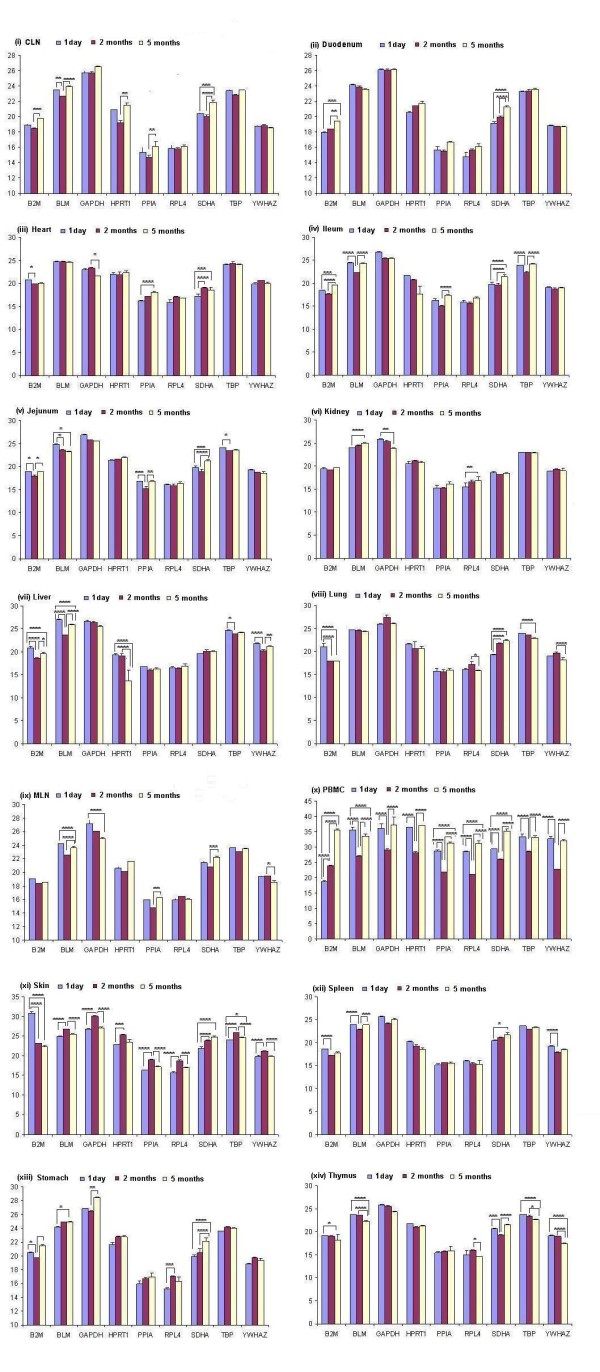
Figure 2.

Average cycle threshold (Ct) values of candidate reference genes tested in porcine tissues at different ages . The values are the average qRT-PCR cycle threshold numbers (Ct values). The bars indicate standard deviation. *P < 0.05; **P < 0.01; ***P < 0.001 and ****P < 0.0001
