
Fig. 3.
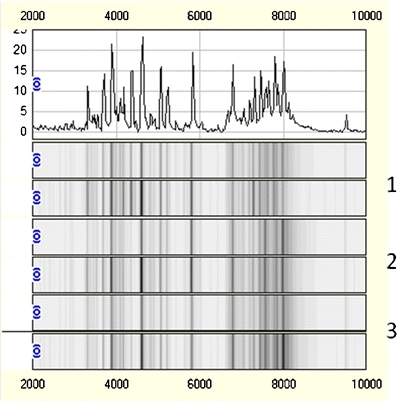
One normal trace for sample 1 combined with gel traces (gel view) showing the protein profiles for both replicates of three representative CIN2-3 samples (labelled 1–3) covering the m/z range from 2000 to 10000
Official websites use .gov
A
.gov website belongs to an official
government organization in the United States.
Secure .gov websites use HTTPS
A lock (
) or https:// means you've safely
connected to the .gov website. Share sensitive
information only on official, secure websites.
One normal trace for sample 1 combined with gel traces (gel view) showing the protein profiles for both replicates of three representative CIN2-3 samples (labelled 1–3) covering the m/z range from 2000 to 10000