Fig. 4.

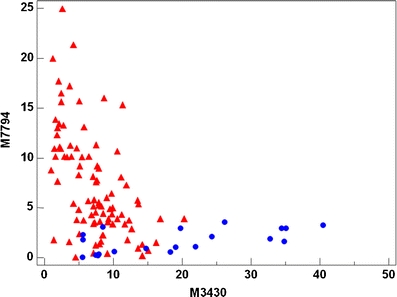
Scatterplot showing the discrimination of the two groups using m/z 3430 and 7794 as variables. Blue circles: Normal samples. Red triangles: CIN2-3 samples

Scatterplot showing the discrimination of the two groups using m/z 3430 and 7794 as variables. Blue circles: Normal samples. Red triangles: CIN2-3 samples