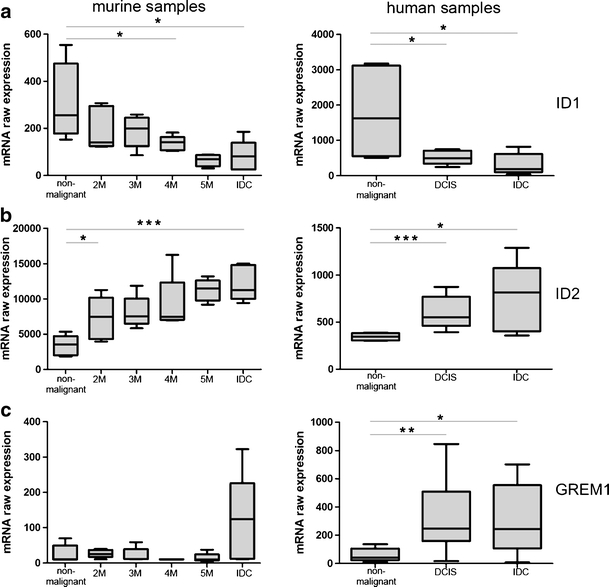
Fig. 5.

Expression values of ID1 (a), ID2 (b) and GREM1 (c) in murine and human samples. Left panel: Expression in WAP-TNP8 mice, right panel: Expression in human mammary tissue. Diagrams show the linearized raw expression values of the Affymetrix Mouse Genome 430 2.0 GeneChip®/Affymetrix Human Genome U133 Plus 2.0 GeneChip®. Expression of ID1 is decreased in malignant tissues in both murine and human samples. Expression of ID2 and GREM1 is increased in malignant tissues
