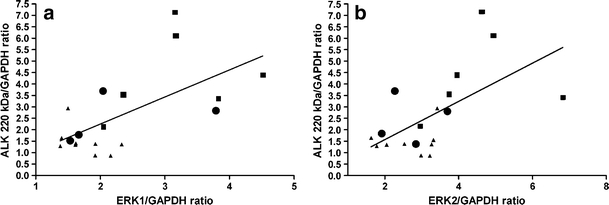
Fig. 2.

ERK1 and ERK2 correlate with ALK expression. a ERK1 protein expression correlates with ALK 220 kDa protein expression (Spearman’s rho r = 0.55, p = 0.02) and ALK 140 kDa protein expression (Spearman’s rho r = 0.56, p = 0.01, graph not shown). b ERK2 protein expression correlates with ALK 220 kDa protein expression (spearman’s rho r = 0.60, p < 0.01) and ALK 140 kDa protein expression (spearman’s rho r = 0.60, p < 0.01, graph not shown). ALK point mutated cell lines are indicated as black squares, ALK WT cell lines as black triangles (including amplified cell lines as black dots). Western blots displayed in Supplementary Figure 2
