
Fig. 2.
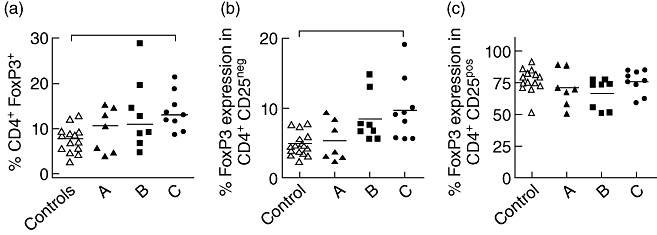
T regulatory cell frequency in different C chronic lymphocytic leukaemia (CLL) disease states. Comparison of CD4+ forkhead box P3 (FoxP3)+ T cell frequency in healthy controls and untreated CLL patients (Binet stages A, B and C) (a). Expression of FoxP3 in CD4+CD25- (b) and CD4+CD25+ (c) T cells from CLL patients at different stages of disease (a–c; according to Binet staging). Solid line represents median. P < 0·05 using Kruskal–Wallis test as indicated by bars on top of graph.