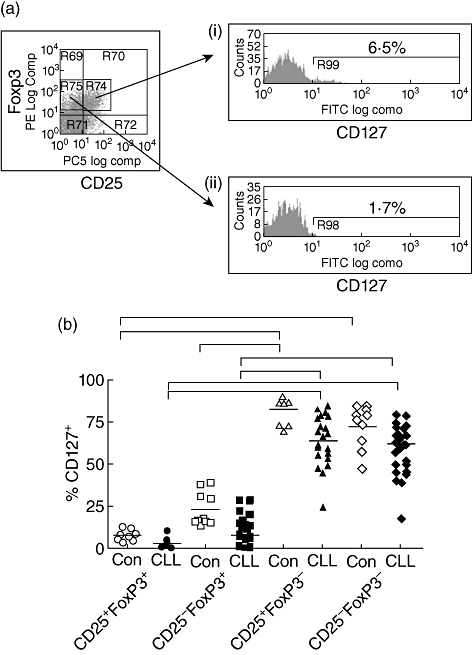
Fig. 3.

Expression of CD127 on different forkhead box P3 (FoxP3)-expressing T cell populations. A representative flow cytometric plot demonstrating FoxP3 versus CD25 expression on CD4+ T cells. (a): histogram plots of CD127 expression on gated regions from (a) (i) CD25+FoxP3- and (ii) CD25- FoxP3+ T cells. Percentage above bar represents % of gated cells positive for CD127. Percentage of CD127-positive cells (y-axis) in different CD25+/− and FoxP3+/− T cell populations are shown for controls and chronic lymphocytic leukaemia (CLL) patients (Fig. 3b). Solid line represents median. P < 0·05 using Friedman's test (paired non-parametric); significant differences are indicated by bars on top of graph.
