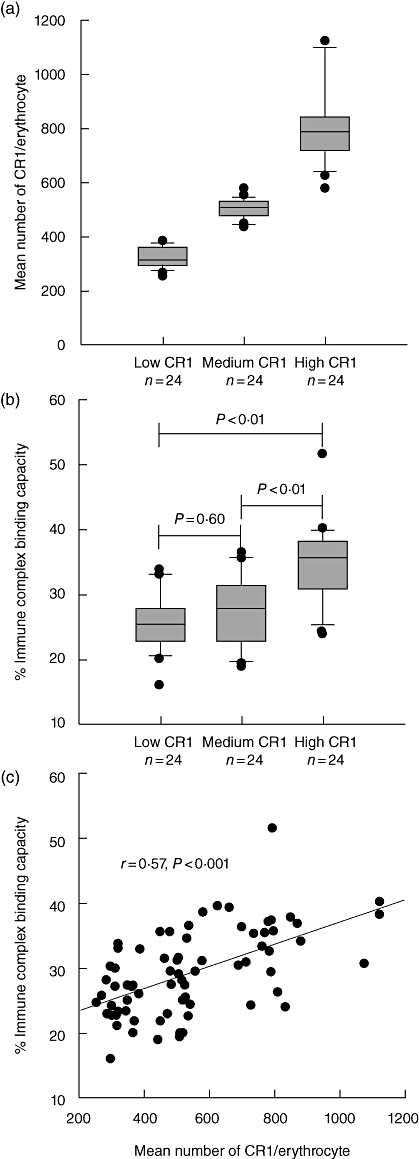
Fig. 1.

Erythrocyte complement receptor 1 (CR1) levels and immune complex (IC) binding capacity. (a) Erythrocyte CR1 levels in low, medium and high CR1 expressors. (b) IC binding capacity of erythrocytes from low, medium and high CR1 expressors. (c) Correlation between erythrocyte IC binding capacity and CR1 level. The box plots indicate the values between the 25th and 75th percentiles, a line within the box marks the median, and the whiskers indicate the 90th and 10th percentiles. The outliers are represented as dots.
