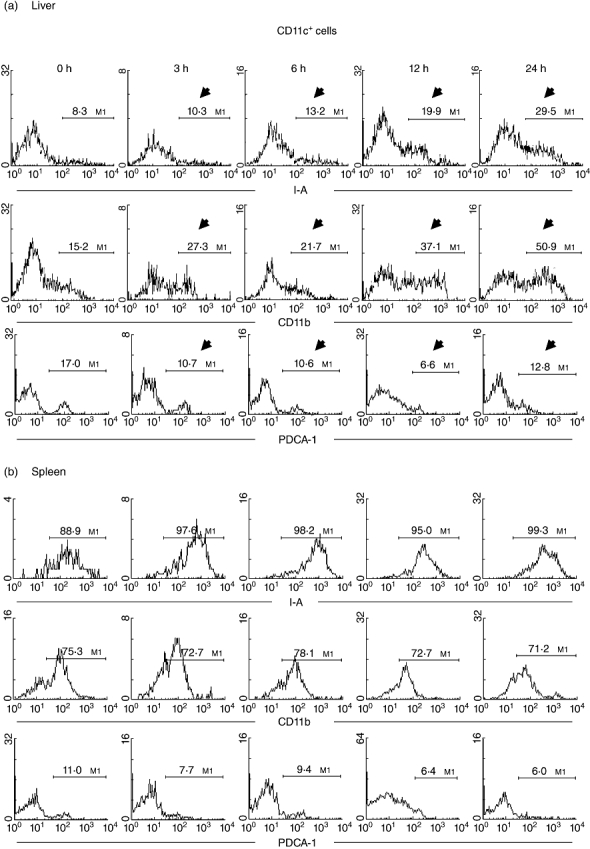
Fig. 4.

Further characterization of dendritic cell (DC) phenotype in (a) liver and (b) spleen. Two-colour staining for CD11c and I-A (or CD11b or PDCA-1) was conducted. Gated analysis was used to examine the proportion of DC expressing I-A, CD11b or PDCA-1. Significant changes are indicated by arrows. Representative data of five experiments are depicted.
