
Fig. 7.
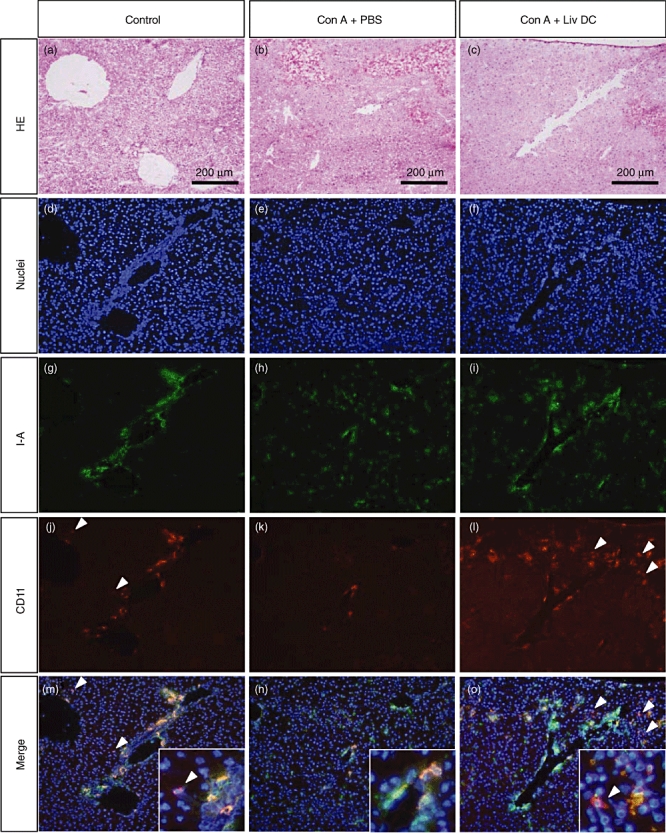
Histology and immunohistochemical staining of the liver. (a, d, g, j, m) Control mice. (b, e, h, k, n) Mice treated with concanavalin A (Con A). (c, f, i, l, o) Mice treated with Con A plus adoptive transfer of liver dendritic cells (DC). (a–c) Haematoxylin and eosin staining. (d–o) Immunohistochemical staining. White arrowheads indicate the CD11c single positive cells. They were only seen in the control liver and the DC-post injected Con A-treated liver, but not in the Con A-treated liver. Representative data of three experiments are depicted.