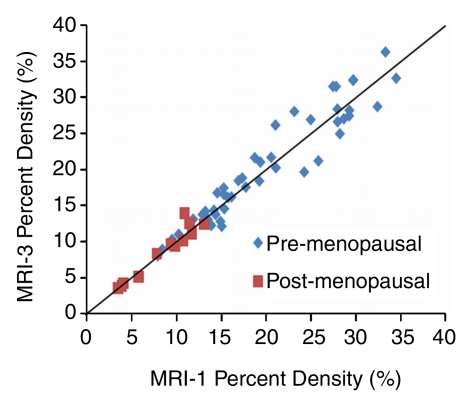
Figure 2b:
Graphs show measured PD from (a) MR imaging 2 (MRI-2), (b) MR imaging 3 (MRI-3), and (c) MR imaging 4 (MRI-4) compared with MR imaging 1 (MRI-1). Data are distributed along the unity line, indicating that there are no discernable systematic differences between MR imaging 2, MR imaging 3, and MR imaging 4 compared with MR imaging 1, but some deviations away from the unity line are clearly visible.

