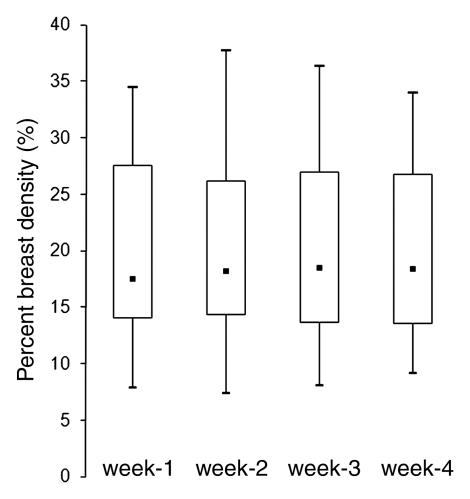
Figure 3a:
(a, b) Box plots show the comparison of PD measured from week 1 to week 4 in (a) premenopausal and (b) postmenopausal women. Bottom and top of the box = 25th and 75th percentiles, respectively. ■ = Median, whiskers = minimum and maximum. The PDs in week 2, 3, and 4 compared with week 1 are not significant (P = .67, .83, and .91, respectively, for premenopausal women and P = .74, .90, and .98, respectively, for postmenopausal women).

