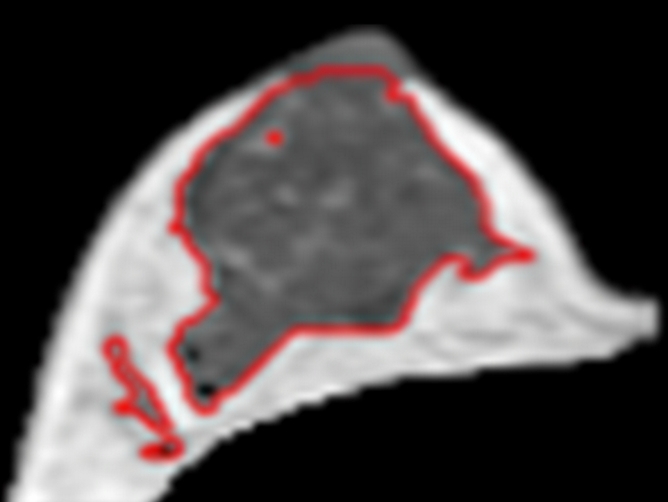
Figure 5d:

(a–d) Representative MR images from the right breast of 30-year-old subject with about 20% variation in Figure 4. Images are from one corresponding location in four MR imaging studies. FVs from (a) week 1, (b) week 2, (c) week 3 to (d) week 4 are 30, 27, 25, and 36 cm3, respectively. It is apparent that the fibroglandular tissue is increased substantially in week 4, corresponding to her late luteal phase. The corresponding PDs are 12.0%, 12.2%, 11.5%, and 16.8%, respectively. CVs for FV and PD are 16.5% and 18.9%, respectively.
